Figure 1.
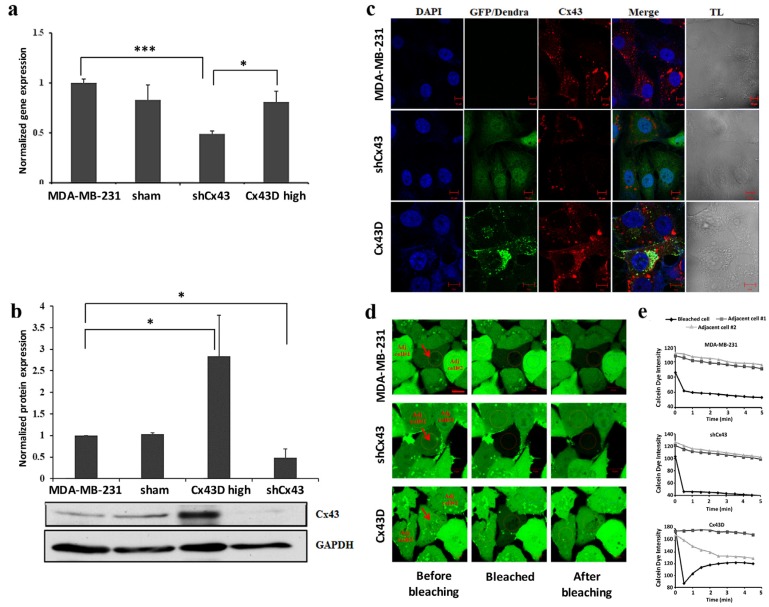
Down-regulation or over-expression of Cx43 in MDA-MB-231 cells. (a) Bar graph representing Cx43 mRNA expression in MDA-MB-231, sham cells, shCx43 and Cx43D cells as detected by qPCR and normalized to GAPDH. Results are representative of three independent experiments. (b) Western blot of Cx43 protein expression in MDA-MB-231, sham cells, shCx43 and Cx43D cells with densitometry analysis of two independent experiments, after normalization to GAPDH. (c) Representative immunofluorescence images of Cx43 expression in parental MDA-MB-231, shCx43 and Cx43D cells. DAPI was used as a nuclear stain and transmitted light (TL) microscopy was used to show cell morphology. GFP/Dendra panel represents the green fluorescence of MDA-MB-231 cells transfected/transduced with shCx43/Cx43D vectors, respectively. Scale bar = 10 µm. (d) Representative fluorescence images of FRAP. Red arrows indicate the photobleached cells; ‘Adj. cell#1 and’ ‘Adj. cell#2’ refer to non-photobleached adjacent cells. Scale bar represents 10 µm. (e) Quantification of fluorescence intensity of regions of interest (ROIs) relative to adjacent unbleached cells. Values represent the fluorescence intensity (averages ± SD) of each ROI based on several measurements calculated by the Zeiss Zen 2011 software. A minimum of ten different ROIs per condition were analyzed. Sham cells are the GFP-negative cells obtained after sorting of shCx43 or Cx43D cells. * p < 0.05; *** p < 0.001.

