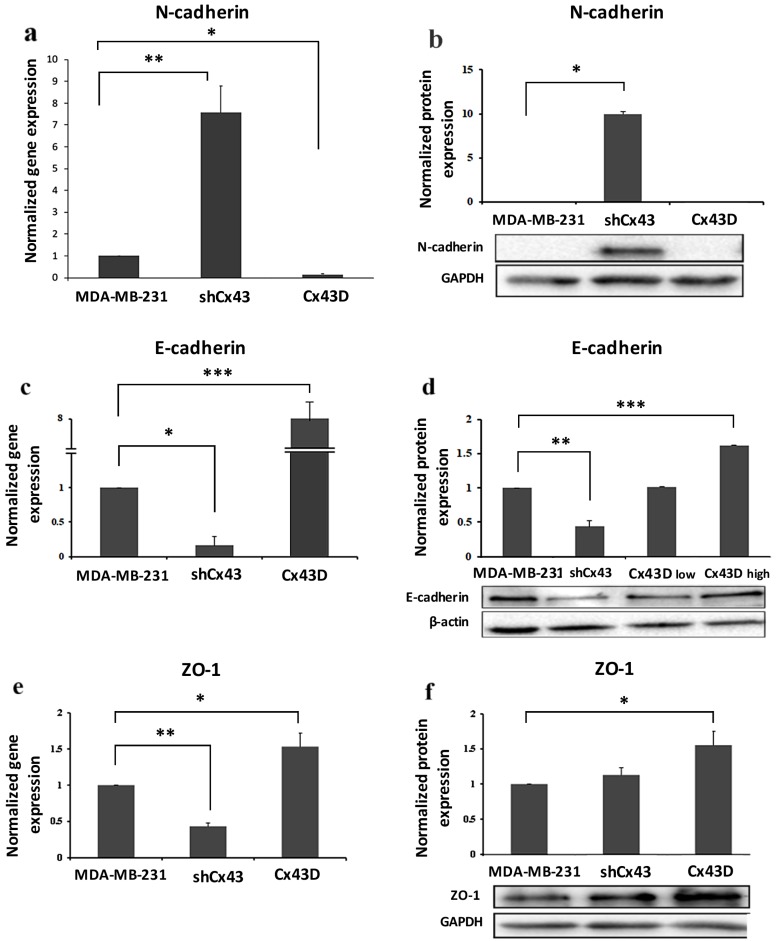
Figure 3.
Cx43 overexpression decreases the expression of EMT markers. (a,c,e) Bar graph displaying N-cadherin, E-cadherin and ZO-1 mRNA expression levels in MDA-MB-231, shCx43 and Cx43D cells, as detected by qPCR and normalized to GAPDH. Results are representative of two independent experiments. (b,d,f) Western blots of N-cadherin, E-cadherin and ZO-1 protein expression in MDA-MB-231 cells, shCx43 and Cx43D cells, with densitometry analysis after normalization to GAPDH (or β-actin). Panel (d) also displays western blotting data of E-cadherin protein levels in Cx43D (low) and Cx43D (high). Results are representative of two independent experiments. * p < 0.05; ** p < 0.01; *** p < 0.001.

