Figure 8.
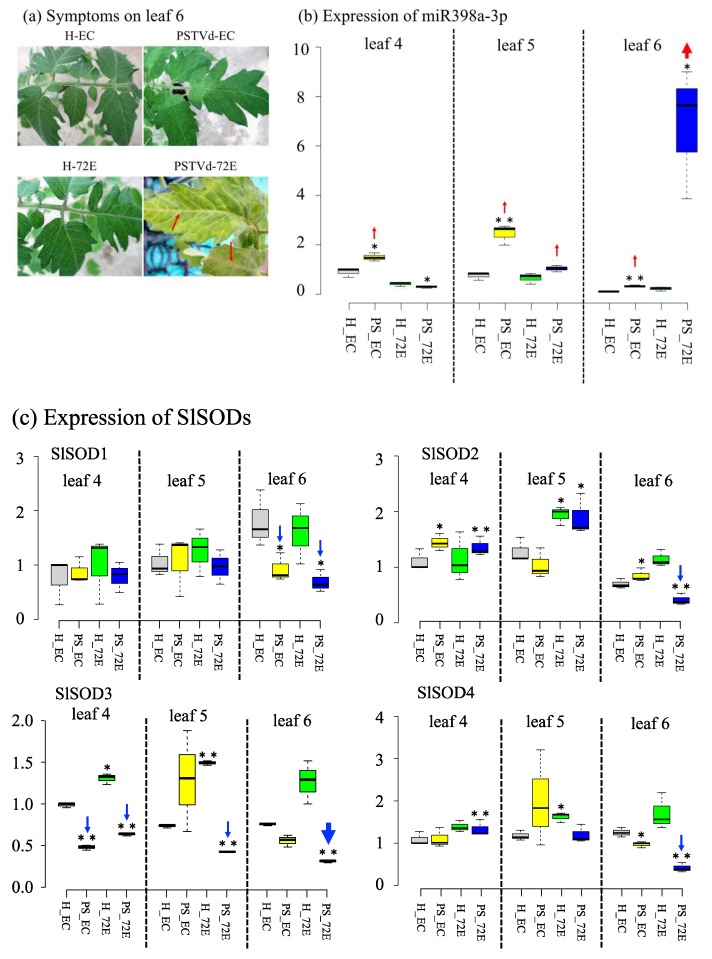
Analysis of miR398a-3p and tomato SODs expression levels in healthy leaves and PSTVd-infected leaves with or without showing necrosis. Panel (a): Three plants each of tomato lines 72E and EC were infected with PSTVd. At 4 wpi, only PSTVd-72E (PS_72E) started to show yellowing accompanied with vein necrosis (arrows) on leaves 5 and 6 (numbers from the bottom). Panel (b): RT-qPCR analysis of miR398a-3p expression revealed that levels of miR398a-3p were unusually high in leaf 6 of PS_72E, which showed necrosis (thick red arrow). Relatively high levels of expression were also found in leaves 4 and 5 in PSTVd-EC (PS_EC) and in leaf 5 in PS_72E (thin red arrow), but the levels were approximately four to five times lower than those in leaf 6 of PS_72E. Samples were collected at 4 wpi. The assay was repeated twice, and each analysis consisted of three biological replicates collected from three plants per treatment. Panel (c): RT-qPCR analysis of the expression of four tomatoes Cu/Zn-SODs (i.e., SlSOD1, SlSOD2, SlSOD3, and SlSOD4) in the same samples revealed that, in response to the highest level of miR398a-3p, SlSOD3 expression decreased most significantly in leaf 6 of PS_72E (thick blue arrow) compared with the healthy line EC (H_EC). SlSOD3 expression levels were also significantly decreased in leaves 4 and 5 of PS_72E, and in leaf 4 of PS_EC. In addition, SlSOD1, SlSOD2, and SlSOD4 expression levels were significantly lower in leaf 6 of PS_72E (thin blue arrow), which showed necrosis. SlSOD3 expression was somewhat higher in leaves 5 and 6 in H_72E. The values with the double asterisk (**; p < 0.01) and single asterisk (*; p < 0.05) were statistically significant at 1% and 5% levels compared to healthy-EC.

