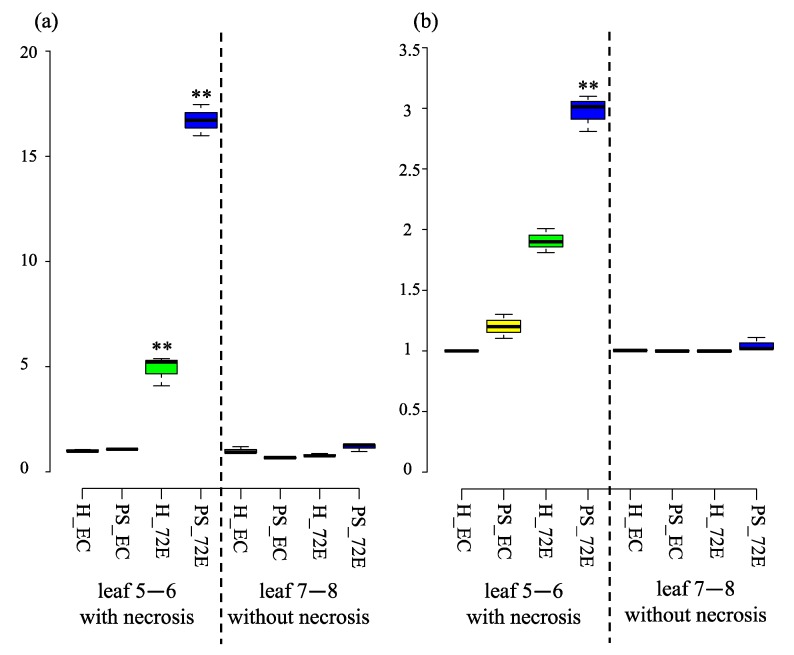
Figure 9.
Relative ROS production (a) and relative ROS scavenging activity (b) in the leaves 5 and 6 (with necrosis) and leaves 7 and 8 (without necrosis). An unusually high level of ROS production and scavenging activity was found in leaves 5 and 6, showing necrosis in PSTVd-72E (PS_72E) compared with healthy-EC (H_EC) plants. A relatively high level of ROS production and scavenging activity was also detected in the leaves 5 and 6 of healthy-72E (H_72E) plants. Leaves of the same plants as described above were used for the analysis. The assay was repeated twice, and each analysis consisted of three biological replicates collected randomly from five plants per treatment. The center lines show the medians; the box limits indicate the 25thand 75thpercentiles as determined using R software; the whiskers extend 1.5-times the interquartile range from the 25thand 75thpercentiles; the dots represent outliers. The values with the double asterisk (**; p < 0.01) was statistically significant at 1% level compared to healthy-EC.

