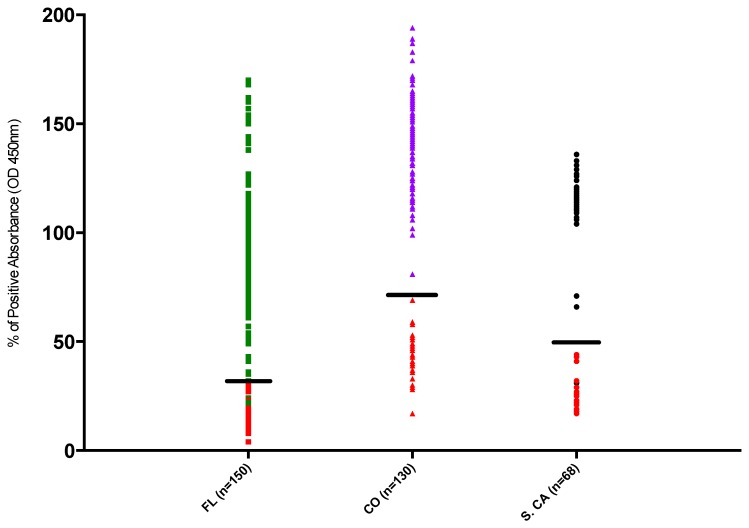
Figure 2.
Seropositive OD values were well distinguished from samples classified as seronegative. The sample points in red were negative; the sample points in green, purple or black were classified as positive for their respective locations. All Colorado and all but one Southern California sample fell into positive absorbance ranges that were clearly segregated (noted with black lines) from samples classified as negative (<70% for CO, <50% for S.CA). 112 of 119 Florida samples classified as seropositive were at least 49% of positive control OD values, with only two positive samples <30% (noted with black line).

