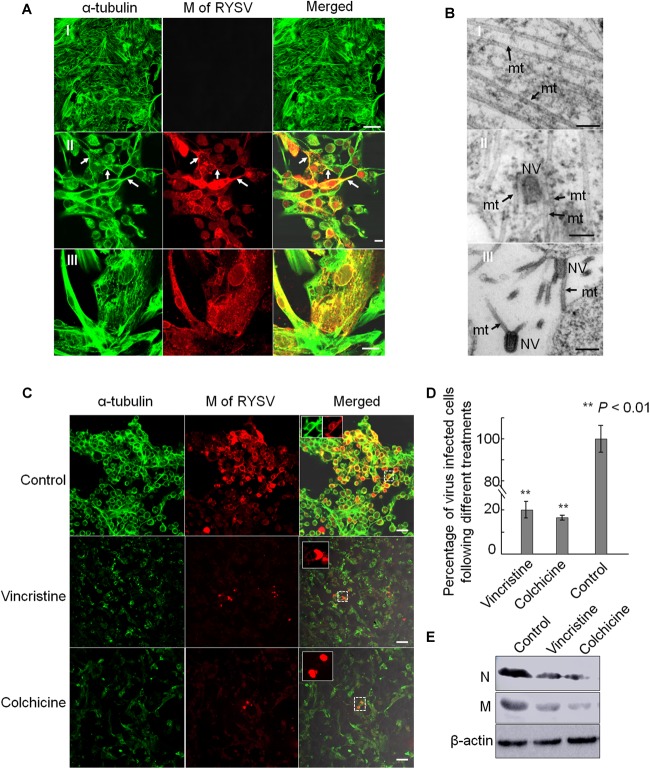
FIGURE 5.
Association of RYSV with tubulin in N. cincticeps vector cell monolayers. (A) Immunofluorescence micrographs of the subcellular co-localization of the M protein with α-tubulin in vector cell monolayers (VCMs) at 72 h after viral inoculation in the non-infected VCM controls (A-I) and infected VCM cells (A-II,III). White arrows indicate the co-localization of M with α-tubulin. Scale bars, 10 μm. (B) Electron micrographs showing RYSV viral particles closely associated with the microtubules in the N. cincticeps VCMs (B-II,III), or the non-infected VCMs (control, B-I). Black arrows indicate microtubules. mt, microtubules; NV, Non-enveloped viral particle(s). Scale bars, 100 nm. (C) Tubulin inhibitors or disrupting reagents inhibited the infection of RYSV in infected VCMs. Scale bars, 10 μm. (D) Infection rates of RYSV following treatments with the tubulin inhibitors. Cells were imaged with an N-R antibody using a confocal microscope at 48 h after treatment. A total of 2500 cells per treatment were counted from three independent biological repeats. The data represent the means ± standard error (SE). P values were estimated using Tukey’s honest significant difference (HSD) test and Statistical significance is indicated by asterisks. (E) The abundance of viral proteins following treatment with the tubulin inhibitor was determined using an immunoblotting assay. N-specific antibodies and M-specific antibodies were used to detect N and M proteins in the VCMs treated with the various reagents at 96 hpi. The abundance of N. cincticeps actin, detected with the β-actin antibody, was used as the control.

