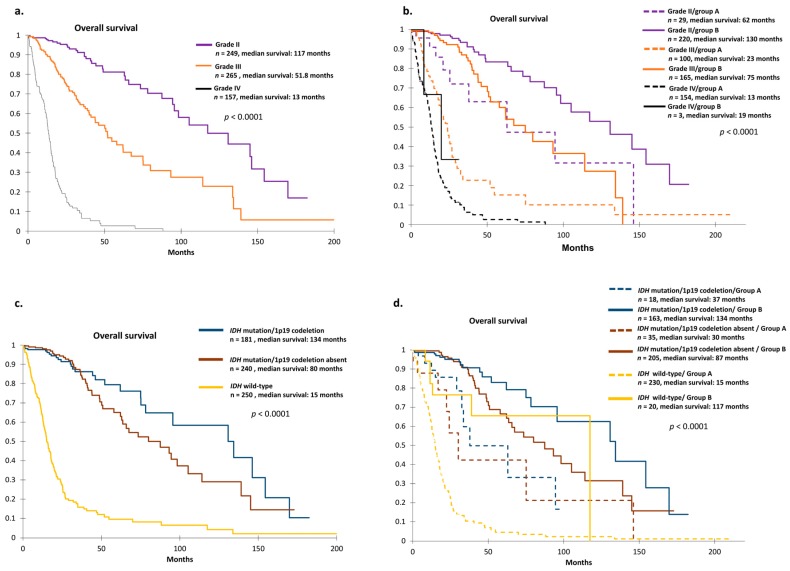
Figure 3.
(a) Overall survival curves according to grade in TCGA cohort by Kaplan–Meier analysis. p-values were calculated using log-rank test. (b) Overall survival curves according to grade and 26-gene signature in TCGA cohort. Survival group A (dotted line) defined unfavorable prognosis, and survival group B (solid line) defined favorable prognosis (p < 0.0001) by Kaplan–Meier analysis. In subgroups for each grade, the 26-gene signature provided information about prognosis. p-values were calculated using log-rank test. (c) Kaplan–Meier overall survival curves according to molecular characteristics in TCGA cohort. p-values were calculated using log-rank test. (d) Overall survival curves according to molecular characteristics and 26-gene signature in TCGA cohort. Survival group A (dotted line) defined unfavorable prognosis, and survival group B (solid line) defined favorable prognosis (p < 0.0001). In each subgroup of molecular characteristics, the 26-gene signature further refined prognosis. p-values were calculated using log-rank test.

