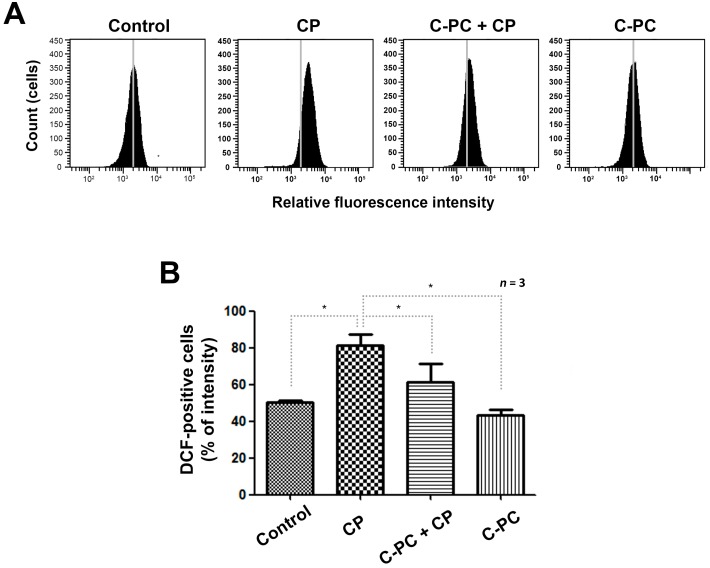
Figure 3.
ROS scavenging capacity of C-PC in cisplatin-treated cells. (A) Measurement of intracellular ROS levels using a fluorescent dye 2′, 7′-dichlorodihydrofluorescein diacetate (DCFH-DA) probe. The fluorescence intensity was detected by flow cytometry. (B) Relative fluorescence-activated cell sorting (FACS) fluorescence intensities. The cells were cultured with 1 μg/mL C-PC for 1 h, followed by treatment with 30 μM CP for 24 h. C-PC, C-phycocyanin; CP, cisplatin. Data are shown as the mean ± standard deviation; * p < 0.05, compared with the cells treated with CP alone.

