Figure 4.
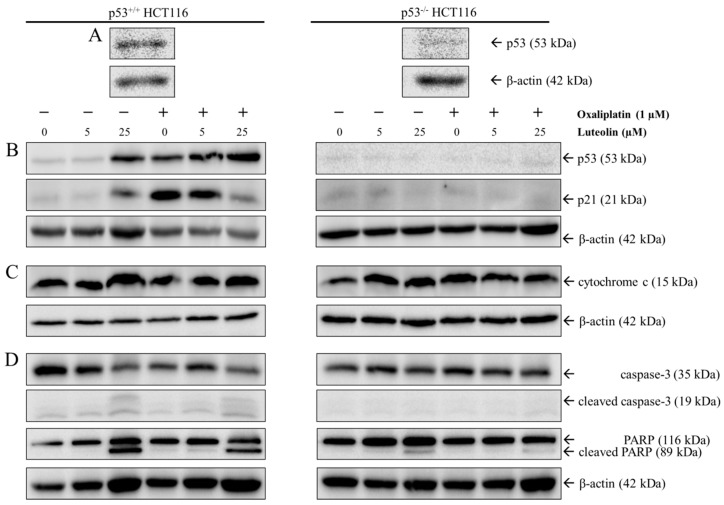
Western blot analysis in p53+/+ and p53−/− HCT116 cells. Representative Western blots of p53 in p53+/+ and p53−/− HCT116 cells (A). Cells were seeded in a 100-mm dish and treated with 5 or 25 μM of luteolin in the absence or presence of 1 μM oxaliplatin for 24 h. Representative Western blots of protein expression changes of p53 and p21 (B), cytochrome c (C), and cleaved caspase-3 and poly-ADP ribose polymerase (PARP) (D) in p53+/+ and p53−/− HCT116 cells.

