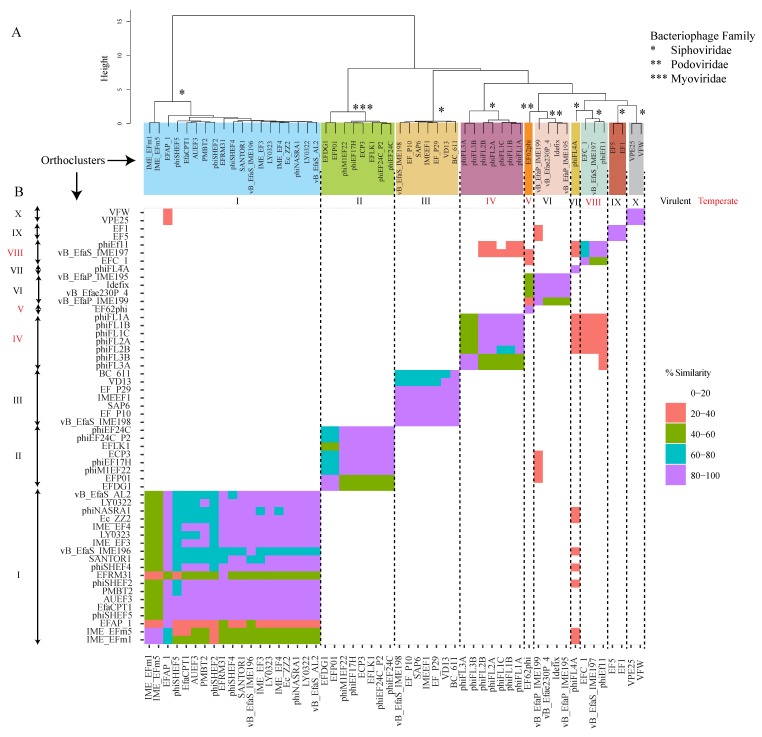
Figure 1.
Genomic comparison of Enterococcus phages. (A) Neighbor-joining tree based on the percentage of shared orthologous genes (1000 bootstrap replicates); squares indicate the 10 phage putative orthoclusters. (B) Dot plot comparison of amino acids identity among the 10 orthoclusters; genes that share more than 40% homology were considered as being part of the same orthologous group. The vertical axis shows phage clusters and phage IDs.

