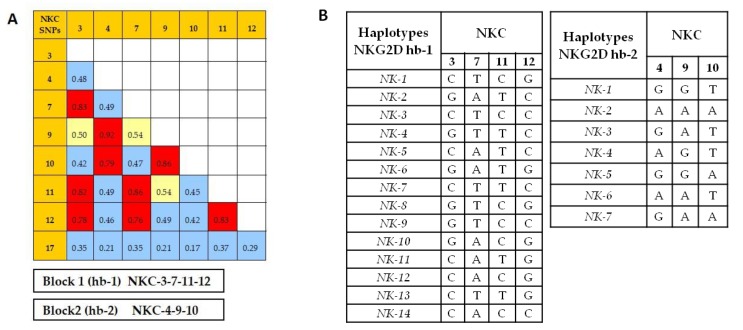
Figure 1.
Linkage disequilibrium analysis between the eight NKC SNPs analyzed in melanoma patients in the Haploview software. (A) The r2 values of the association with each SNP are represented: r2 values > 0.7 (high grade of linkage disequilibrium) in red; r2 values between 0.5 and 0.7 in yellow; and r2 values < 0.5 in blue. (B) The two blocks of SNPs in close linkage are also represented; block Hb-1 including SNPs NKC3, NKC7, NKC11, and NKC12, and block Hb-2 including SNPs NKC4, NKC9, and NKC10.

