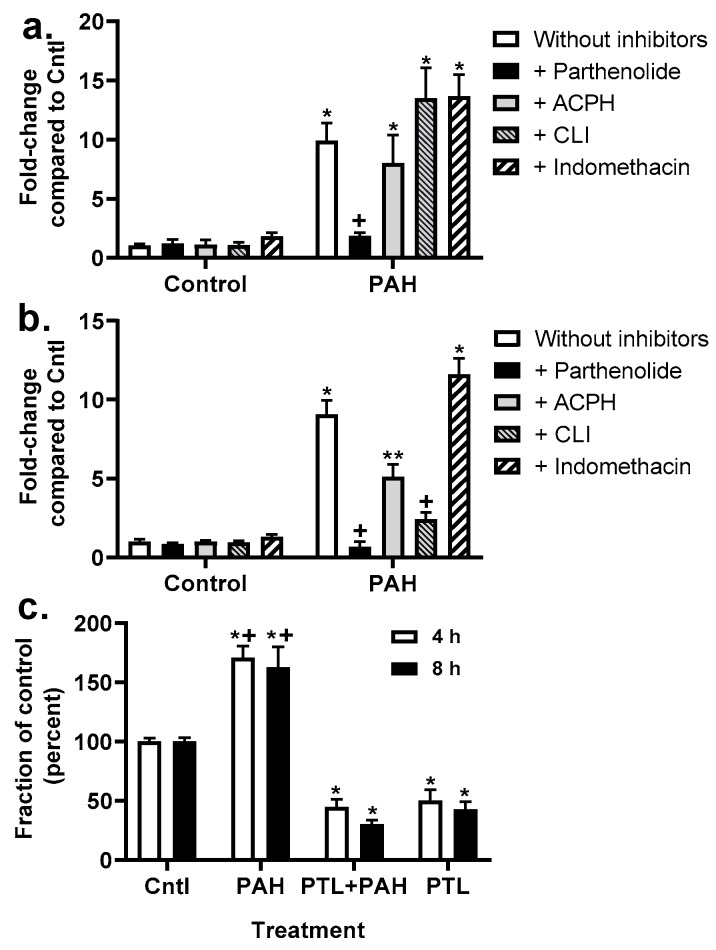
Figure 6.
KC transcript and protein levels are elevated in response to LMW PAHs and inhibited in the presence of PTL. Kc transcript levels in C10 (a) and E10 (b) cells in response to 4 h PAH exposure (40 μM 1:1 ratio of 1-methylanthracene and fluoranthene) ± inhibitors. For (a,b), * p < 0.05 for treatment compared to control (DMSO); + p < 0.05 for PTL or CLI + PAH compared to PAH without inhibitors; ** p < 0.05 for ACHP+PAH compared to PAH without inhibitors. Experiments repeated 2–3 times with an n = 3 per treatment. (c) KC proteins levels were measured (ELISA) at 4 and 8 h following PAH mixture in C10 cells ± PTL (parthenolide) (10 μM). Experiments repeated 3 times with an n = 3 per treatment per experiment.

