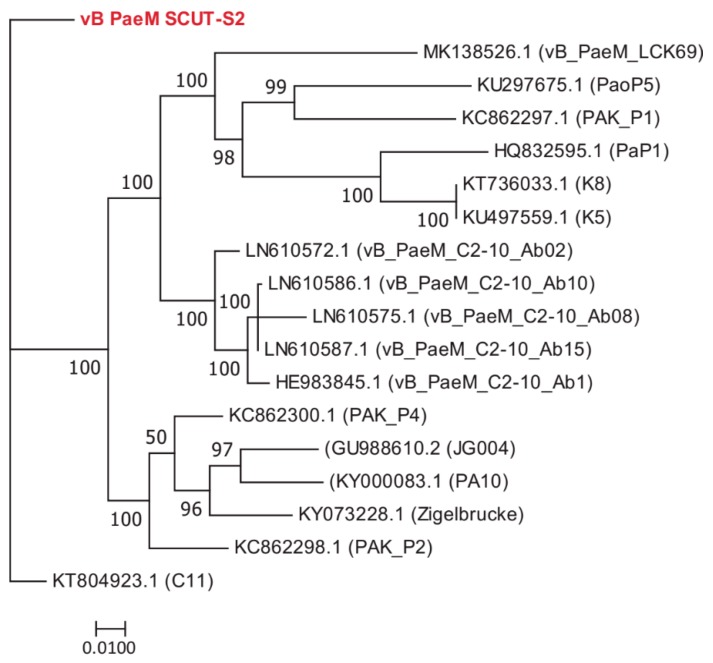
Figure 5.
Maximum likelihood tree showing the phylogenetic relationships among phages of genus Pakpunavirus. The whole genome sequences were aligned by MAFFT [37] and the tree was visualized by MEGA 7 [40]. The value at the nodes indicated the bootstrap support scores as calculated using 1000 replicates. Phage vB_PaeM_SCUT-S2 was colored red.

