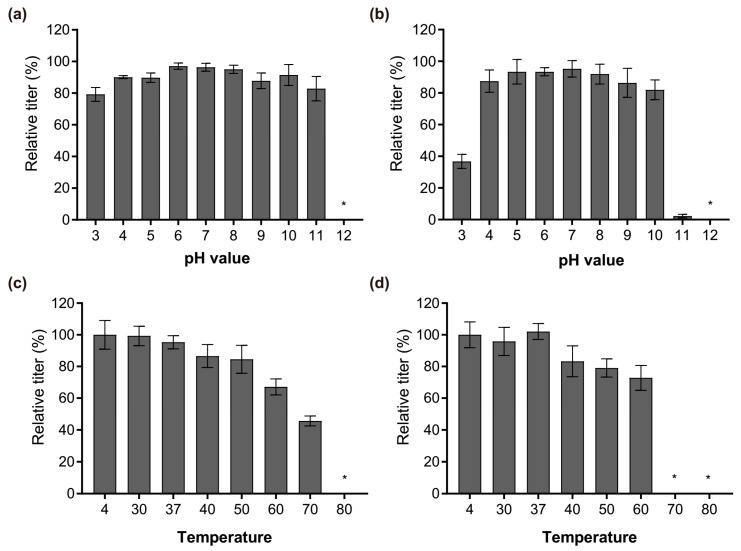
Figure 6.
Relative amount of infectious phage particles after different treatments. (a) vB_PaeM_SCUT-S1 and (b) vB_PaeM_SCUT-S2 incubated for 1 h at different pH levels; (c) vB_PaeM_SCUT-S1 and (d) vB_PaeM_SCUT-S2 incubated for 1 h at different temperatures. * No plaques were detected at pH 12 for either Phages S1 and S2 (a,b), at 80 °C for Phage S1 (c) and at 70 °C or 80 °C for Phage S2 (d), indicating that the phages were completely inactive in these conditions. Three independent experiments were performed.

