
Figure 2.
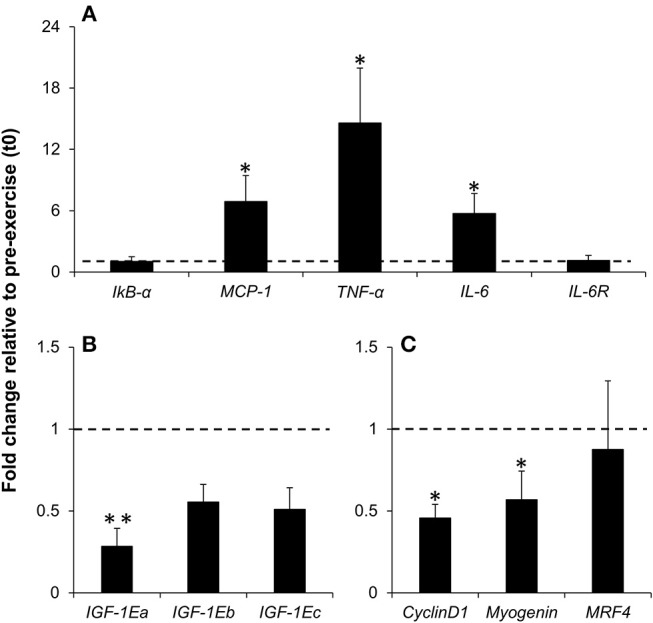
Fold change in IkBα, MCP-1, TNF-α, IL-6, IL-6R (A), IGF-1 isoforms (B) and cyclin D1, myogenin and MRF4 (C) mRNA levels in muscle FNA samples obtained 2 h post-exercise (t1) compared to the pre-exercise (t0) (represented by the dotted line). Values are mean ± SE. *, significant difference from t0 (p < 0.05); **, highly significant difference from t0 (p < 0.01); n = 8.