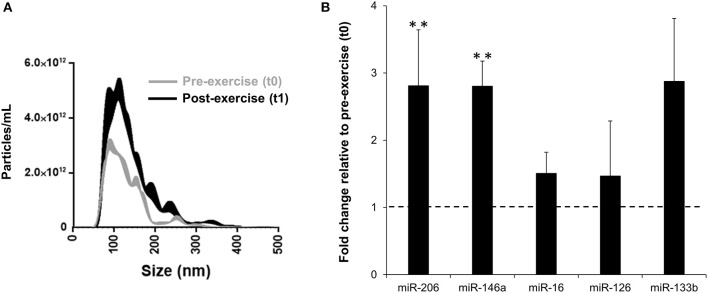
Figure 5.
Post-exercise (t1) vs. pre-exercise (t0) nanoparticle tracking assay of circulating EVs (A) and fold change in miRNA levels in circulating EVs (B). Pre-exercise values within (B) are represented by the dotted line. Values are mean ± SE. **, highly significant difference from t0 (p < 0.01); n = 8.

