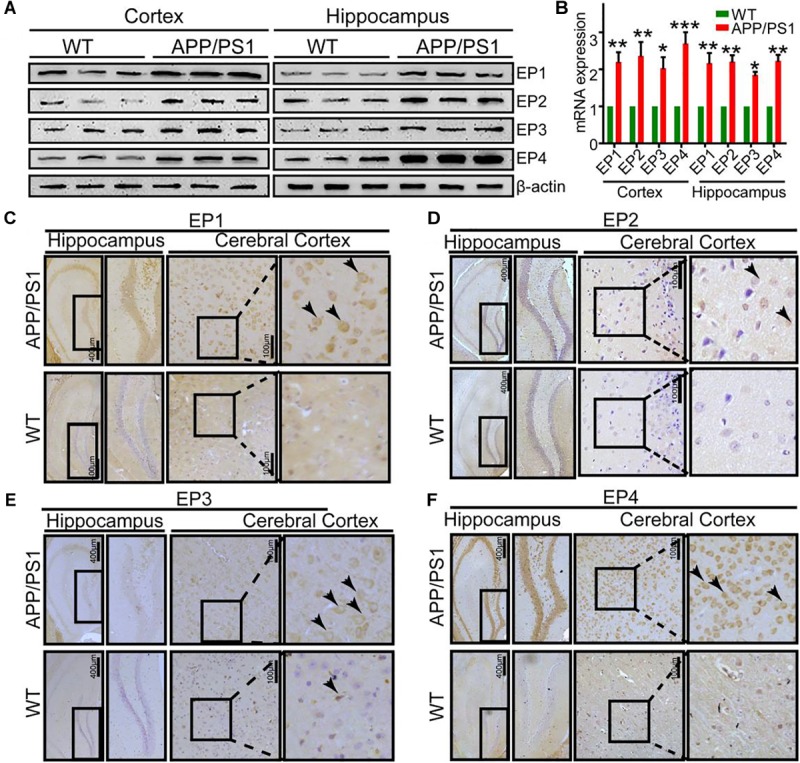
FIGURE 4.

The expression of EPs is upregulated in APP/PS1 Tg mice. (A–F) The brains of 9-month-old APP/PS1 Tg mice were collected after anesthesia and perfusion (n = 6). (A,B) The mRNA and protein expression levels of EP1-4 were determined by qRT-PCR and western blotting, respectively. β-actin and GAPDH served as the internal controls. (C–F) The morphology of EP1-4 was determined by immunohistochemistry. The scale bar represents 400 or 100 μm. These images are representative of six independent mouse experiments. The data represent the means ± S.E. of independent experiments. ∗p < 0.05, ∗∗p < 0.01, and ∗∗∗p < 0.001 with respect to the WT mice.
