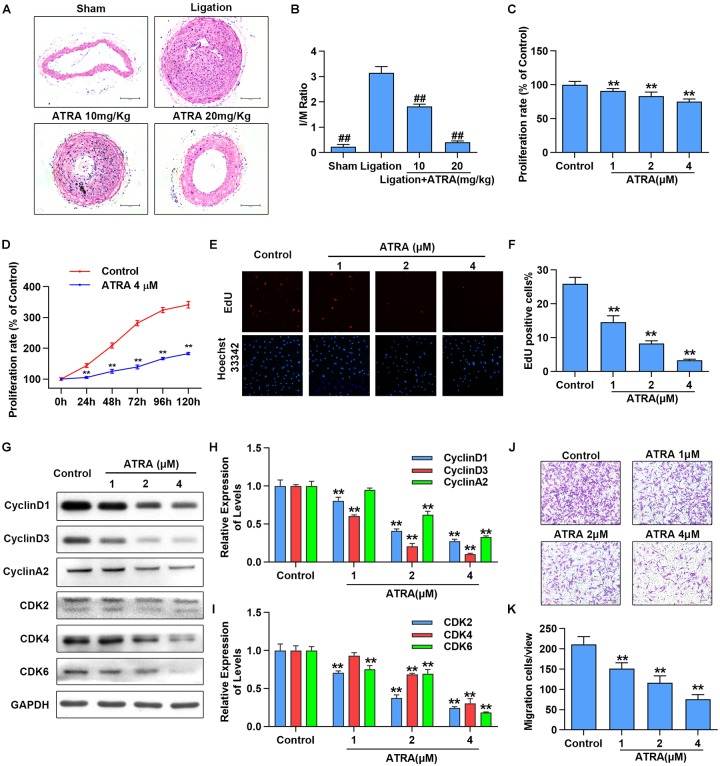
FIGURE 1.
ATRA inhibited neointimal hyperplasia and suppressed the proliferation and migration of VSMC. (A) Representative sections of the left common carotid arteries from the sham group, ligation group and ATRA-treated groups by hematoxylin–eosin staining. (B) Morphometric quantification of intimal/media (I/M) ratio (n = 8). (C) A7r5 cells were incubated with the indicated doses of ATRA (1, 2 as well as 4 μM) for 24 h, followed by the MTS assay to determine the proliferation of A7r5 (n = 6). (D) A7r5 cells were treated with ATRA (4 μM) for 0, 24, 48, 72, 96, and 120 h, and MTS assay was performed to test cell proliferation rate (n = 6). (E) Representative images of EdU staining. EdU (in red) stained the regions of cell proliferation; Hoechst33342 (in blue) stained the nuclei. (F) Percentage of EdU positive cells of A7r5 (n = 3). (G) The expressions of CyclinD1, CyclinD3, CyclinA2, CDK2, CDK4, and CDK6 were tested via western blotting. (H) Relative levels of CyclinD1, CyclinD3, and CyclinA2 (n = 3). (I) Relative expression levels of CDK2, CDK4, and CDK6 (n = 3). (J) A7r5 cells were treated with different concentrations of ATRA (1, 2, and 4 μM), and tested by performing Transwell assays for 12 h. (K) The number of cells in each field of view (n = 5). Data are presented as mean ± SD. #p < 0.05, ##p < 0.01 compared with the ligation group. ∗p < 0.05, ∗∗p < 0.01 compared with the Control group.

