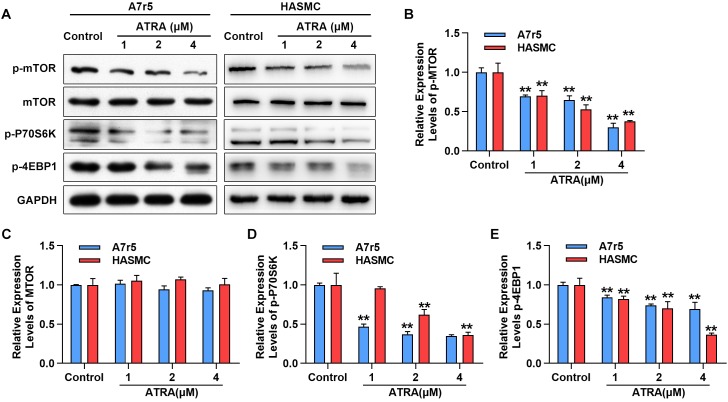
FIGURE 3.
ATRA suppressed mTOR signaling pathway. (A) A7r5 and HASMC cells were incubated with the indicated doses (1, 2 as well as 4 μM) of ATRA for 6 h, (B) levels of p-mTOR, mTOR, p-p70S6K as well as p-4EBP1 were tested via western blotting. (C) Relative expression levels of p-mTOR and total-mTOR. (D) Relative expression level of p-p70S6K (n = 3). (E) Relative expression level of p-4EBP1 (n = 3). Data are shown as mean ± SD. ∗p < 0.05, ∗∗p < 0.01 compared with the Control group.

