FIGURE 5.
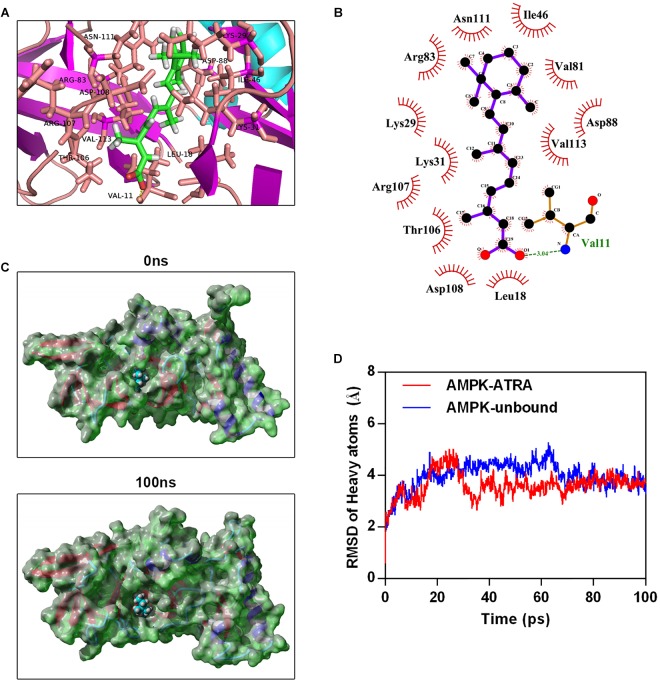
Molecular simulations for the interaction of ATRA with AMPK. (A) Three dimensional crystal structure of ATRA in complex with AMPK (PDB ID: 4QFR). ATRA are shown in green, and the hydrogen bonds are indicated by the yellow line. (B) Two dimensional crystal structure of ATRA in complex with AMPK. (C) Surface presentation of the AMPK-ATRA complex crystal structure at 0 ns and 100 ns. (D) Plots of root mean square deviation (RMSD) of heavy atoms of AMPK unbound (blue) and AMPKα-ATRA complex (red).

