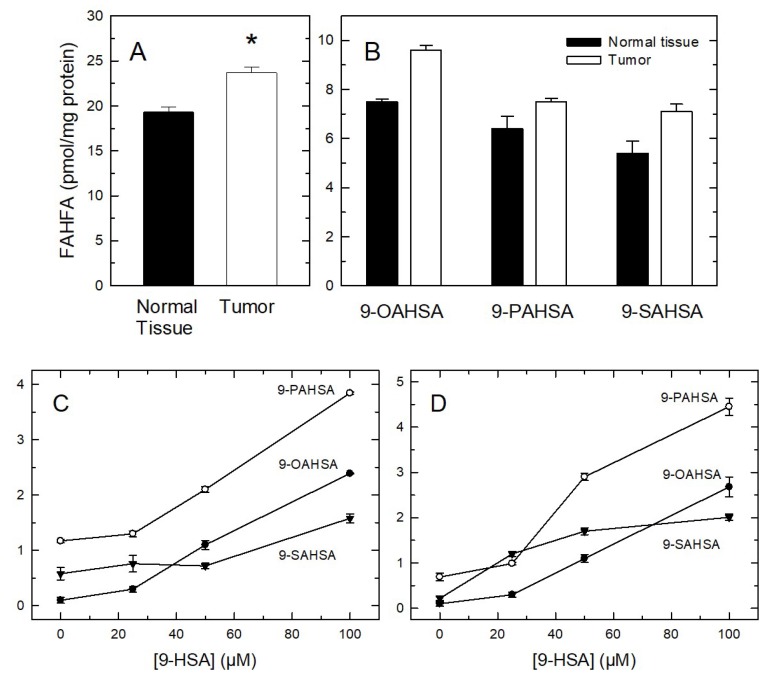
Figure 7.
Determination of FAHFA levels in tumors and cell lines. (A) Total 9-HSA-containing FAHFA levels in normal tissue (black bar) or tumor (open bar) is indicated. (B) Identification of distinct FAHFA molecular species in normal tissue (black bars) and tumor (open bars). (C) FAHFA species present in HCT-116 cells increase when the cells are incubated with 9-HSA. (D) FAHFA species present in HT-29 cells increase when the cells are incubated with 9-HSA. Data are expressed as means ± SEM (n = 11 for tumors; n = 3 for cell lines). * Significantly different (p < 0.05) from normal tissue.

