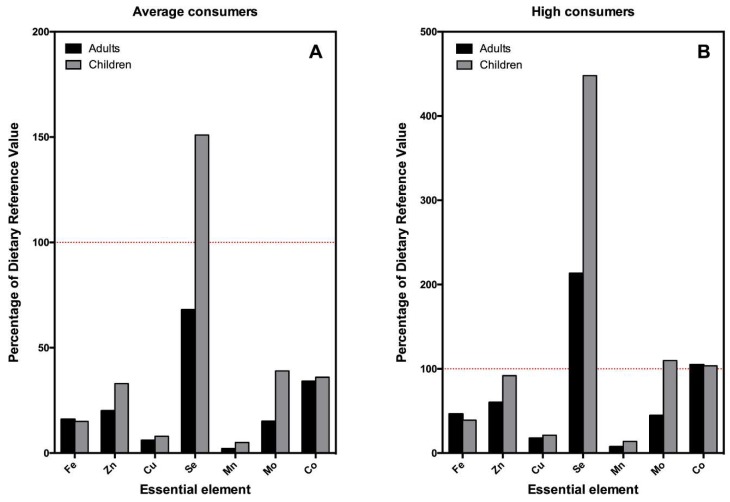
Figure 1.
Bar plot indicating the percentage of the dietary reference values (DRVs) of essential elements provided by the consumption of mussels in adults and children. (A) Average consumption (percentile 50); (B) high consumption (percentile 97.5). Red dotted line indicates 100% of the DRVs of each element. Shaded area between lines indicates.

