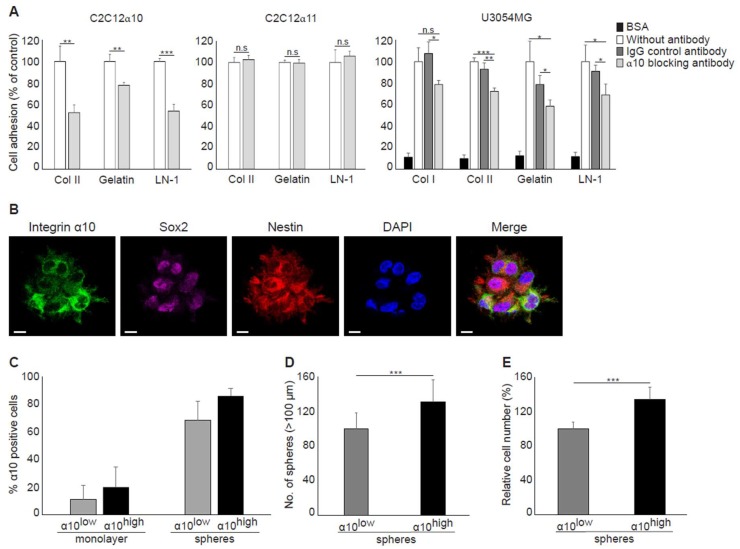
Figure 4.
Integrin α10β1 mediates adhesion to collagen and laminin and promotes sphere formation and proliferation. (A) Adhesion of mouse myoblast cells C2C12 transduced with integrin α10 vector (C2C12α10) or integrin α11 vector (C2C12α11) and GBM U3054MG cells to dishes pre-coated with collagen I (Col I), collagen II (Col II), gelatin, or laminin-111 (LN-1) for 1 h in the absence or presence of an isotype control IgG2a antibody or a function-blocking monoclonal integrin α10 antibody. Bovine serum albumin (BSA)-coated wells were used as a negative and non-specific control. Adhered cells were quantified by crystal violet and spectrophotometric analysis. The bar graph shows percentage cell adhesion compared with non-treated control cells. Data are one representative experiment, and error bars show the SD in triplicates. Statistically significant differences were determined by unpaired two-tailed Student’s t-test, where * p ˂ 0.05; ** p ˂ 0.01; *** p ˂ 0.001. n.s.: not significant. (B) Unsorted U3054MG cells cultured as spheres. Triple immunofluorescence labeling of integrin α10 protein, Sox2 and Nestin, DAPI staining of cell nuclei, and a merged image (Merge). Scale bars represent 10 µm. (C) The number of integrin α10-positive cells measured by flow cytometry of α10high- and α10low-sorted U3054MG cells grown in monolayer or as spheres. Data are presented as the mean from three independent experiments. (D) Sphere formation capacity of α10high-and α10low-cells measured after 7 days of culturing. Microscopy images of each well were taken and spheres that had reached a diameter of more than 100 µm were counted using ImageJ software. Data are presented as the mean from five independent experiments. (E) Cell proliferation of α10high- and α10low- cells after 4‒5 days of culturing as spheres was determined by using the WST-1 cell proliferation assay. Data are presented as the mean from four independent experiments. The number of spheres and relative cell number is normalized against α10low-cells. Error bars show the SD, and the unpaired two-tailed Student’s t-test was performed, where * p ˂ 0.05; ** p ˂ 0.01; *** p ˂ 0.001.

