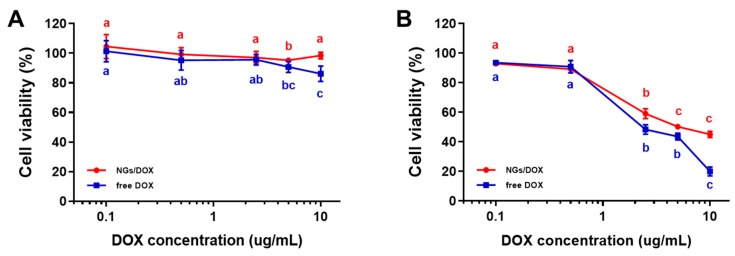
Figure 5.
Cytotoxicity test. Cell viabilities of NIH3T3 cells treated with DOX-GelMA NGs and free DOX for (A) 4 h and (B) 24 h. Data are presented as the average ± standard deviation (n = 9). Cell viability with different letters (a–c) show significant differences depending on DOX concentrations (p < 0.05).

