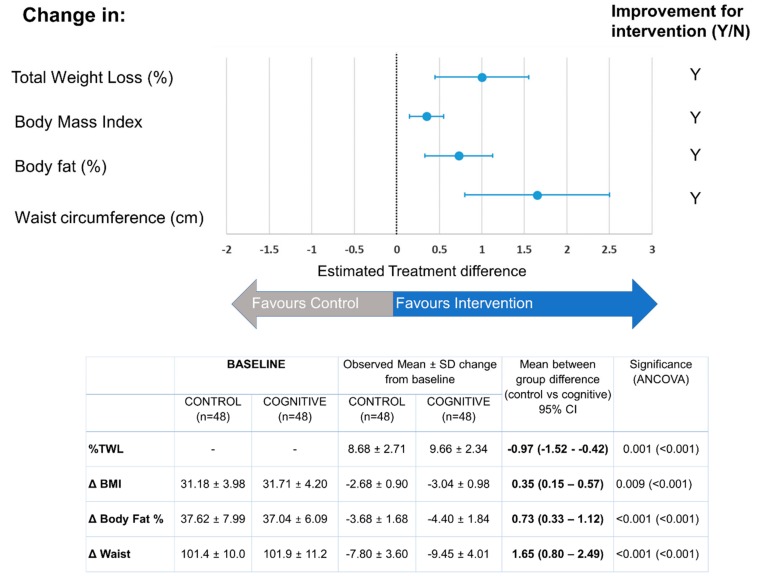
Figure 2.
Three-month change estimates for anthropometric variables by treatment. Mean ± SD. Between-group differences were estimated as Mean Cognitive—Mean Control value. A 95% confidence interval of between-group differences is shown in parentheses. Significance was analysed by an ANCOVA test. Significance data, controlling for baseline anthropometric values and sex, is shown in parentheses. Statistical significant differences that are favourable to the cognitive group have been denoted in bold.

