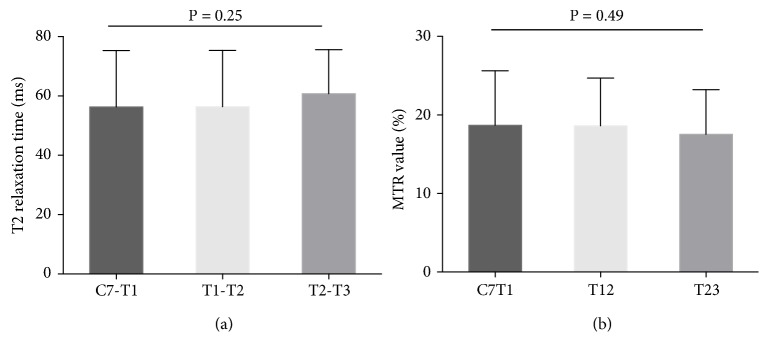
Figure 2.
T2 relaxation time values and MTR values at different segmental levels. (a) No significant difference of the T2 relaxation time values at different levels was detected (P = 0.25, by one-way ANOVA). (b) MTR values of three anatomical levels showed no significant difference (P = 0.49, by one-way ANOVA).

