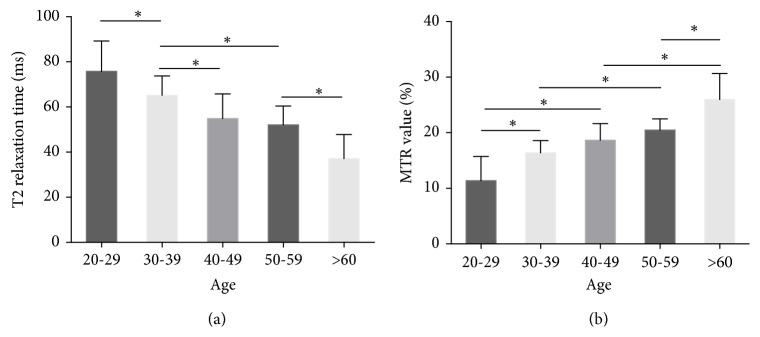
Figure 3.
T2 relaxation time values and MTR values at different age. (a) The T2 relaxation time values decreased evidently with the increased age. (b) The MTR values generally increased with the increasing age. ∗P < 0.05. All P values of multicomparisons were calculated by post hoc test of one-way ANOVA.

