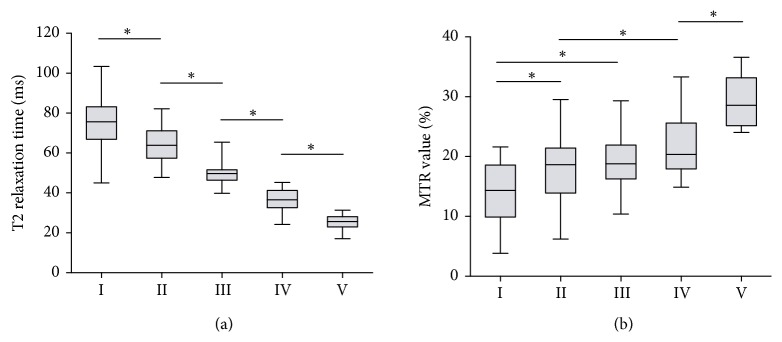
Figure 4.
T2 relaxation time values and MTR values of different Pfirrmann grades. (a) The T2 relaxation time values declined from grade I to grade V with statistical significance existing in the comparison of each two adjacent Pfirrmann grades (all P < 0.05). (b) The MTR values increased with the advance of the Pfirrmann grade without detecting significant differences between grade II and III and between grade III and grade IV. ∗P < 0.05. All P values of multicomparisons were calculated by post hoc test of one-way ANOVA.

