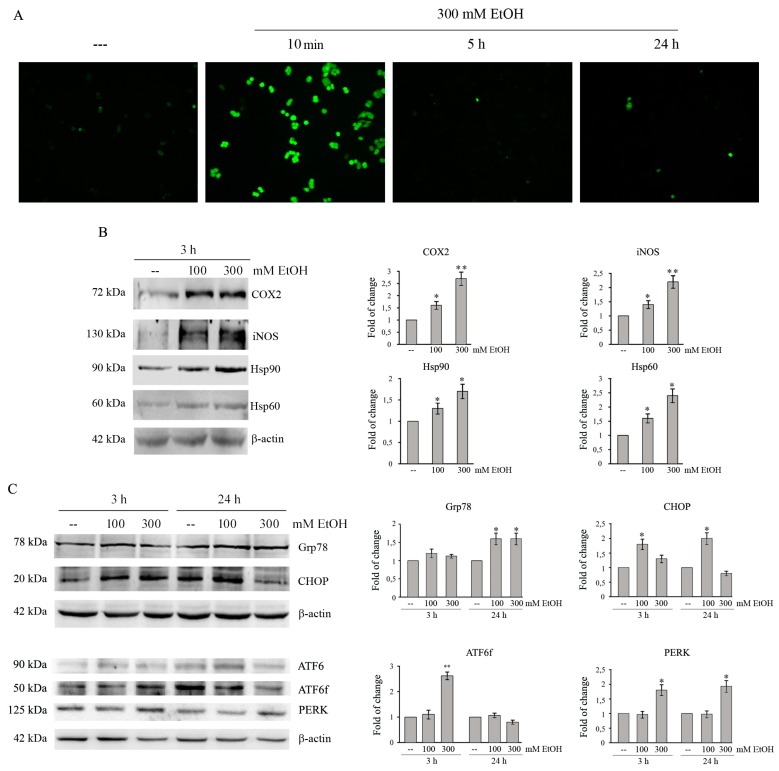
Figure 2.
Ethanol induces oxidative and ER stress in colon cancer cells. (A) HCT116 cells (7 × 10³) were treated with 300 mM EtOH for the indicated times. Reactive oxygen species (ROS) production was assayed by H2DCFDA staining. Images were taken by a Leica DC300F microscope (200× original magnification) using a FITC filter. Results are representative of three independent experiments. (B,C) Cells (1 × 10⁵) were treated with 100 or 300 mMEtOH for the indicated times. Cell lysates (30 μg) were analyzed by Western blotting for COX2, iNOS, Hsp90, and Hsp60 (B) or Grp78, CHOP, ATF6 and its fragmented form (ATF6f) and PERK (C). Densitometric analysis of bands was carried out as reported in Material and Methods and data were normalized to β-actin expression. Results are from three independent experiments and statistical significance was determined using one-way ANOVA followed by Bonferroni’s test. (*) p < 0.05 and (**) p < 0.01 compared to the untreated sample.

