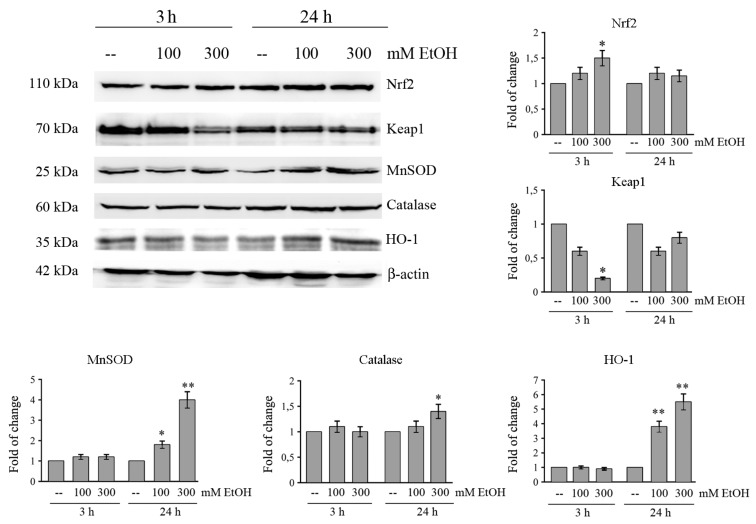
Figure 4.
Effects of ethanol on Nrf2-dependent antioxidant pathway in HCT116 cells. Cells (1 × 10⁵) were incubated in the presence of various doses of EtOH for different periods. The levels of Nrf2, Keap1, MnSOD, catalase, and HO-1 were assessed by Western blotting analysis. Immunoblot was quantified by densitometry and normalized against β-actin expression. Results are from three independent experiments and statistical significance was determined using one-way ANOVA followed by Bonferroni’s test. (*) p < 0.05 and (**) p < 0.01 compared to the untreated sample.

