Figure 2.

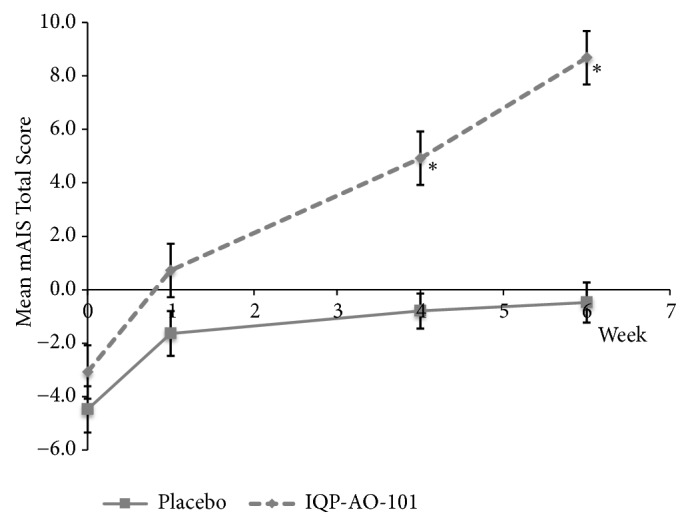
Mean mAIS total score (all parameters) during the 6-week IP intake. ∗p < 0.001 vs. placebo. Error bars denote standard error of mean.

Mean mAIS total score (all parameters) during the 6-week IP intake. ∗p < 0.001 vs. placebo. Error bars denote standard error of mean.