
Fig. 3.
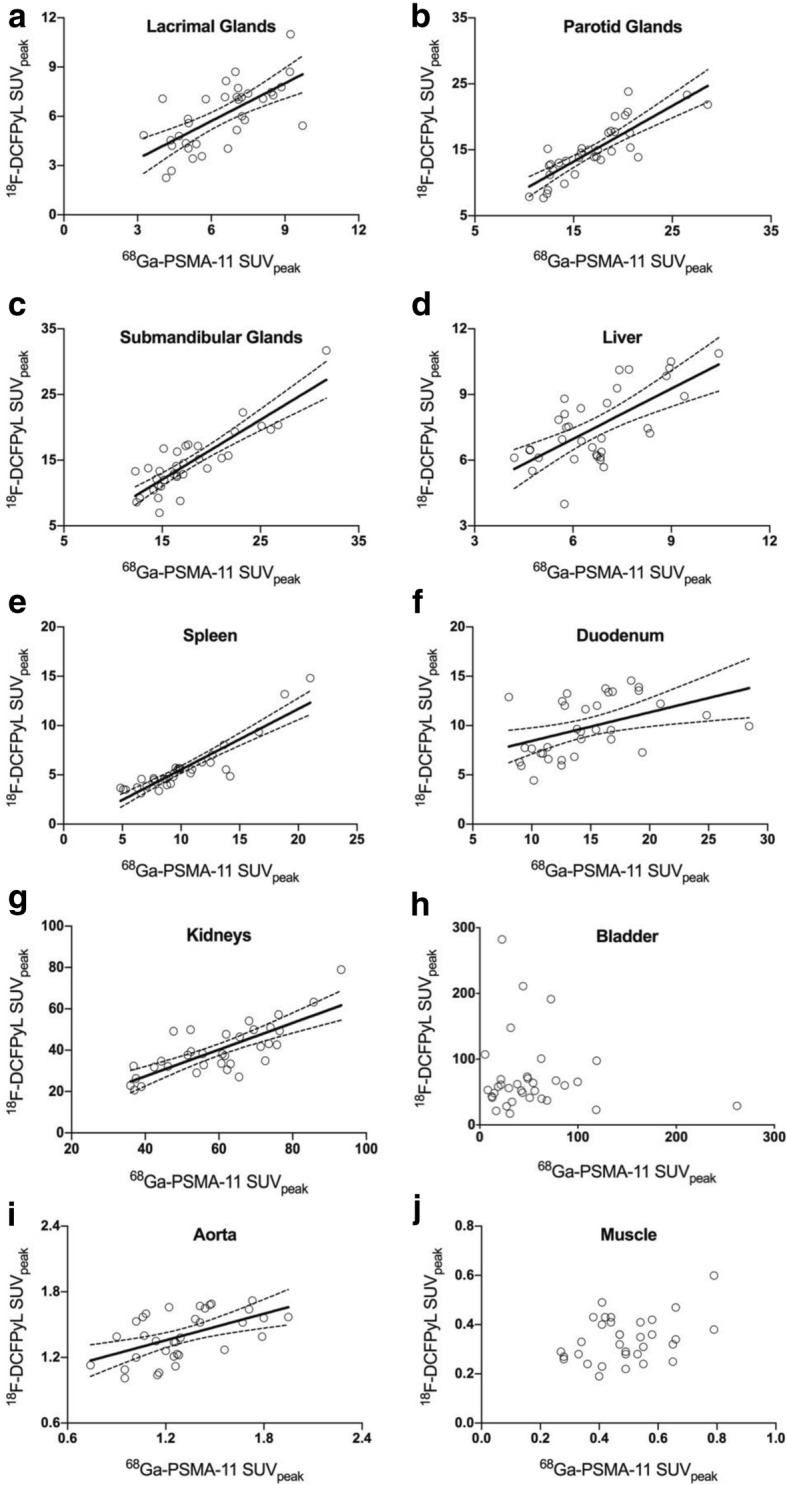
Scatter Plotts depicting the relation of quantitative uptake values (SUVpeak) between the two scans in each of the target organs (y axis: 18F-DCFPyL SUVpeak; x axis: 68Ga-PSMA-11-SUVpeak). Statistically significant correlations (p < 0.01) show the corresponding regression lines and 95% CI for the slope