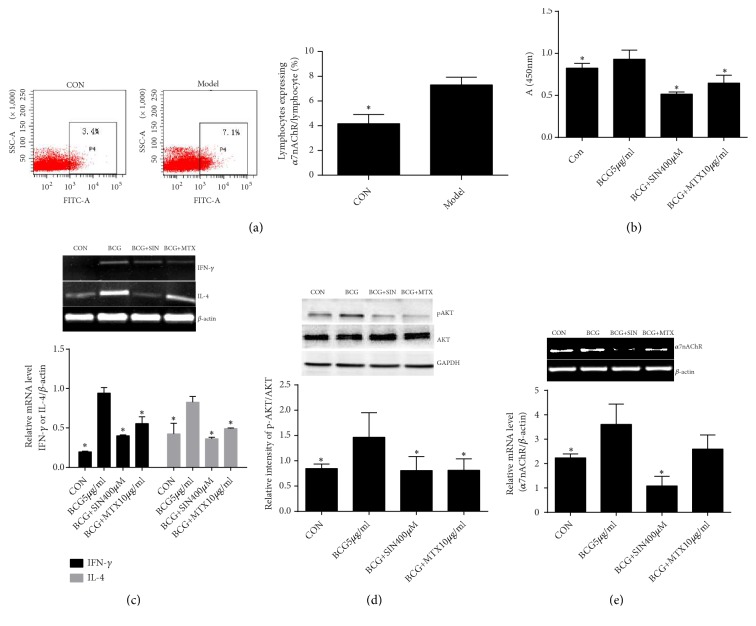
Figure 5.
Effect of SIN on activated lymphocytes and α7nAChR expression. (a) Lymphocytes expressing α7nAChR in control or AIA rats were measured by flow cytometry (n=3). (b) Lymphocyte proliferation was detected by the CCK8 assay (n=5). mRNA expression of (c) IFN-γ, IL-4 and (e) α7nAChR was detected by RT-PCR and (d) protein expression of pAKT and AKT was detected by western blot in lymphocytes (n=3). Data are expressed as mean ± SEM. ∗P<0.05 versus the model or BCG group.

