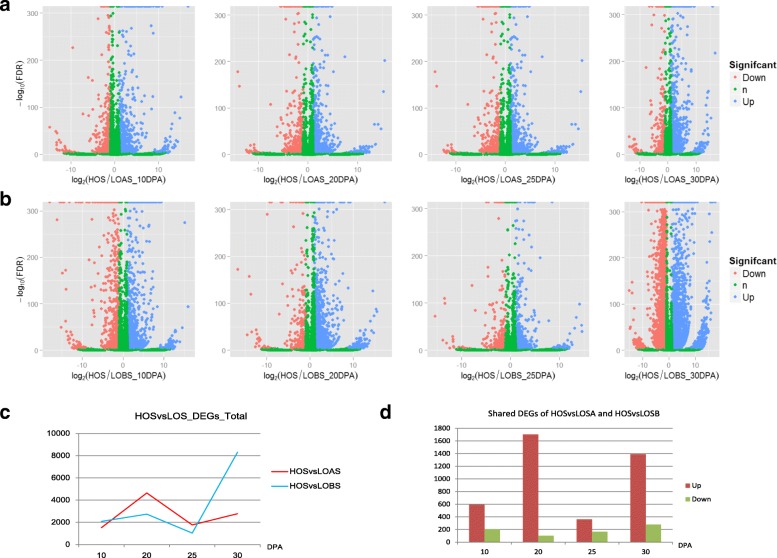
Fig. 2.
The differentially expressed genes in the high and low oil content sesames during seed development. a Volcano plot illustrating the DEGs between HO and LOA at different stages. The blue, red and green spots indicate the up-, down-, and normally regulated genes, respectively. b Volcano plot illustrating the DEGs between HO and LOB at different stages. c Numbers of the DEGs between the high and low oil content sesames during seed development. d The shared DEGs between HO and LOAS/LOBS

