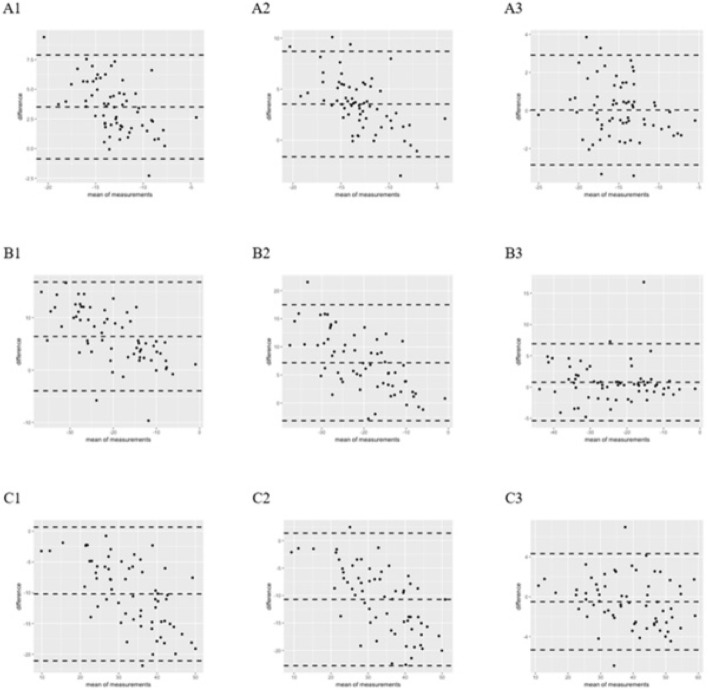
Fig. 1.
Bland-Altman scatter diagram of strain among VSSLV, VISLV, and VISLA. Compared with VIS, VSS had a larger bias and a wide 95% consistency range. Within VIS, the bias was small and the consistency range was relatively narrow. Sct: VSSLV - VISLV (A1), VSSLV - VISLA (A2), VISLV - VISLA (A3). Scd: VSSLV - VISLV (B1), VSSLV - VISLA (B2), VISLV - VISLA (B3). Sr: VSSLV - VISLV (C1), VSSLV - VISLA (C2), VISLV - VISLA (C3)

