Fig. 3.
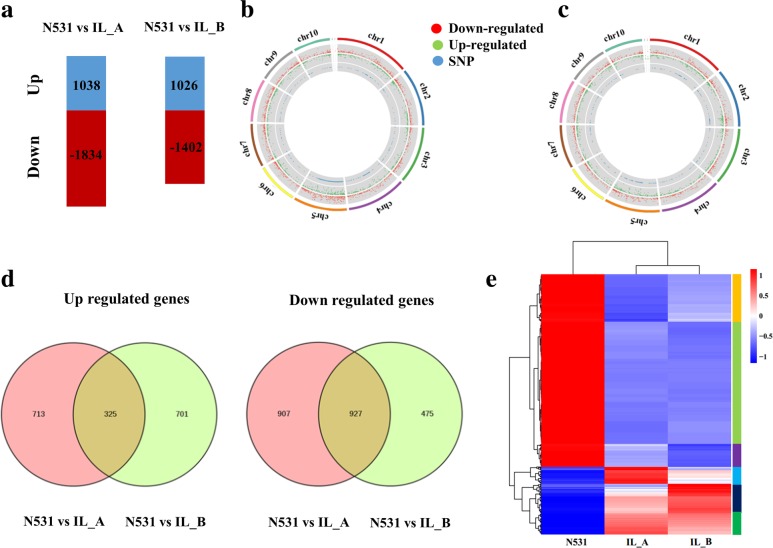
Transcriptome analysis of N531 and ILs. a Number of upregulated genes (blue) and downregulated genes (red) between N531 and IL_A, N531 and IL_B. b-c Distribution of single nucleotide polymorphisms (SNPs) and differentially expressed genes (DEGs) at the 5-mm immature ear stage between N531 and IL_A (b), N531 and IL_B c The three circles from inner to outer show the distribution of SNPs (blue dots), upregulated genes (green dots) and downregulated genes (red dots), respectively. d Venn diagrams showing the overlap of DEGs (upregulated and downregulated genes) between N531 and ILs. e Heatmap clustering 1252 common DEGs by their expression abundance (FPKM). The different colors represent different levels of FPKM. The rectangular bar consisted of 6 colors representing different clusters from I to VI

