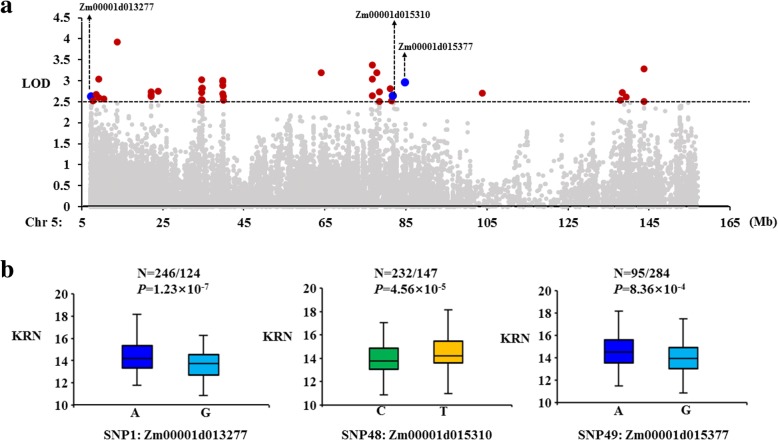
Fig. 5.
Regional association analysis. a Association analysis between the SNPs located in the 7–156 Mb on chromosome 5 and the KRN. The black dashed line represents the significance threshold (LOD > 2.5). The red dots represent the significantly associated SNPs, and the three blue dots represent SNPs located in the DEGs identified by RNA-Seq. b Phenotype analysis of maize inbred lines with different alleles of SNP1, SNP48 and SNP49 in the association panel. Boxes with different colors represent different nucleotide bases

