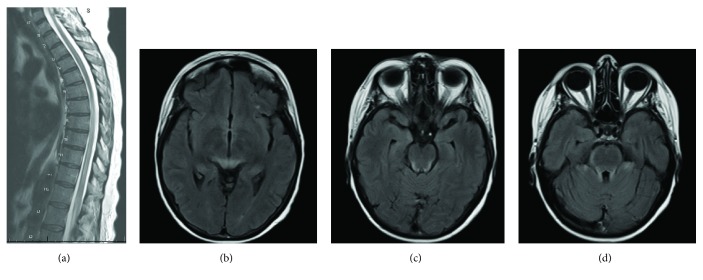
Figure 1.
MRI images of severe IT chemotherapy complications. (a) Increased T2 signal throughout the spinal cord, most prominent from T6 to the conus. There is some associated cord expansion. The cord signal involves almost the entire diameter most noted at T8. (b-d) Brain images showing symmetric FLAIR signal abnormality in the brainstem, cerebellum, and possibly the thalami without diffusion restriction or abnormal enhancement.

