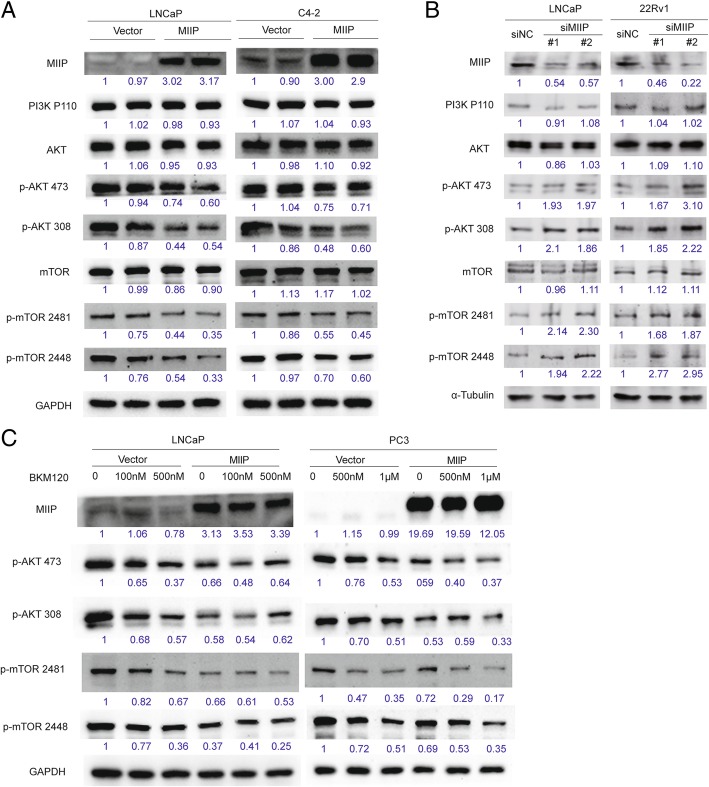
Fig. 3.
MIIP negatively regulates AKT-mTOR signaling. (a, b) Western blot analysis of key components of PI3K-AKT-mTOR signaling pathway [PI3K (p110), AKT, p-AKT (Ser473), p-AKT (Thr308), p-mTOR (Ser2481) and p-mTOR (Ser2448)] in stable control or MIIP-overexpressing LNCaP and C4–2 cells, and in LNCaP and 22Rv1 cells transfected with siNC or two individual MIIP-targeting siRNAs . (c) Western blot analysis of p-AKT (Ser473), p-AKT (Thr308), p-mTOR (Ser2481) and p-mTOR (Ser2448) in stable control and MIIP-overexpressing LNCaP and PC3 cells treated with BKM120 (0, 100 nM, 500 nM, or 1 μM). Each band’s intensity was quantified by Image J software, with the relative values (GAPDH or tubulin as internal control) of the left-most band being designated as 1 and the values of the others relative to it shown below

