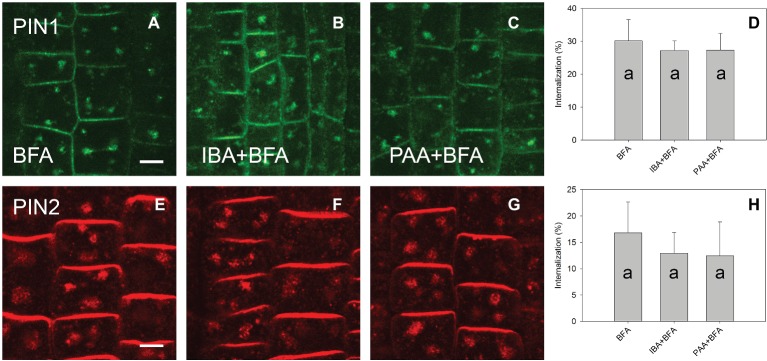
Figure 4.
The effect of IBA and PAA on PIN1 and PIN2 internalization. (A,E) PIN1 and PIN2 internalization after BFA (50 μM) treatment. (B–D) IBA and PAA did not inhibit PIN1 internalization; (F–H) IBA and PAA did not inhibit PIN2 internalization. Scale bars represent 5 μm. Data are means of 8–9 seedlings; error bars represent SD. Means with different letters are significant (p < 0.05).

