
FIGURE 3.
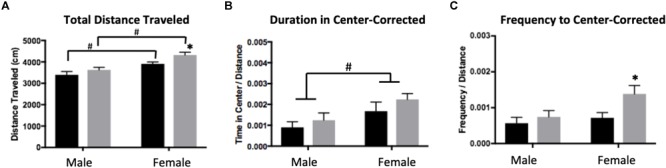
Distance traveled (A), duration of time spent in the center (B), and frequency of visits to the center (C) of an open field in adulthood following maternal separation ELS or control rearing in males and females. Means ± SEM are shown. ∗p < 0.05 difference between Con and ELS. #p < 0.05 main effect of sex or p < 0.05 difference between male and female of same treatment group. n = 6–8.