
FIGURE 7.
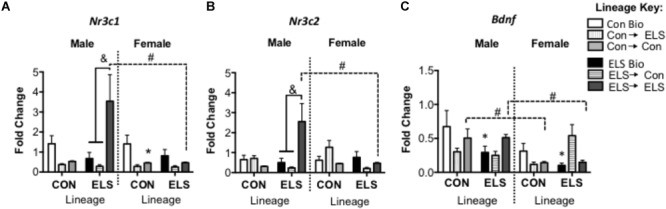
Hippocampal mRNA expression of Nr3c1 (A), Nr3c2 (B), and Bdnf (C) in F2 generation males and females. Means ± SEM are shown. ∗p < 0.05 difference from Con Bio (∗ over male and female ELS Bio represents a main effect of lineage, rather than a pairwise comparison). &p < 0.05 difference between upbringing groups within Con or ELS lineage. #p < 0.05 difference between males and females of same lineage and upbringing. n = 6–8.