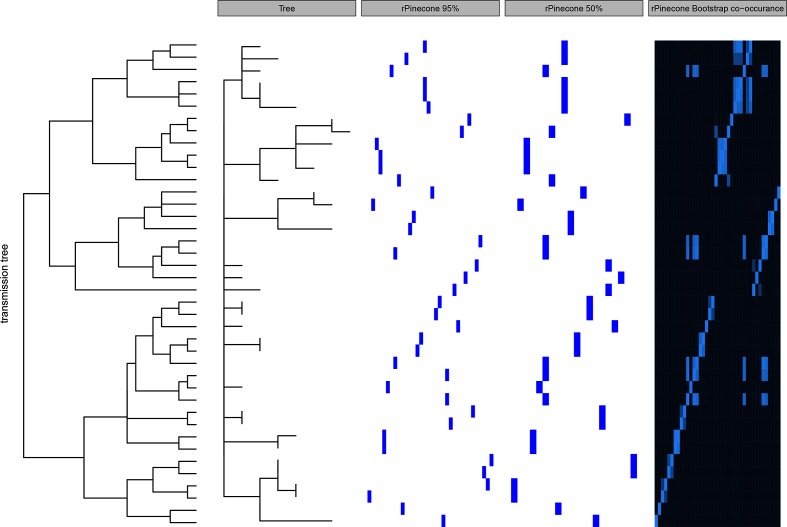
Fig. 3.
Robustness and the uncertainty of the clusters generated by rPinecone was assessed using bootstrap replicates of isolates from simulated data. Clusters were generated from a co-occurrence matrix to represent when rPinecone clusters isolates together at 50 and 95 % of the time (intervals). Panels are, from left to right: original transmission tree, SNV-scaled phylogenetic tree, rPinecone clustering at the 95 % interval, rPinecone clustering at the 50 % interval and co-occurrence matrix.

