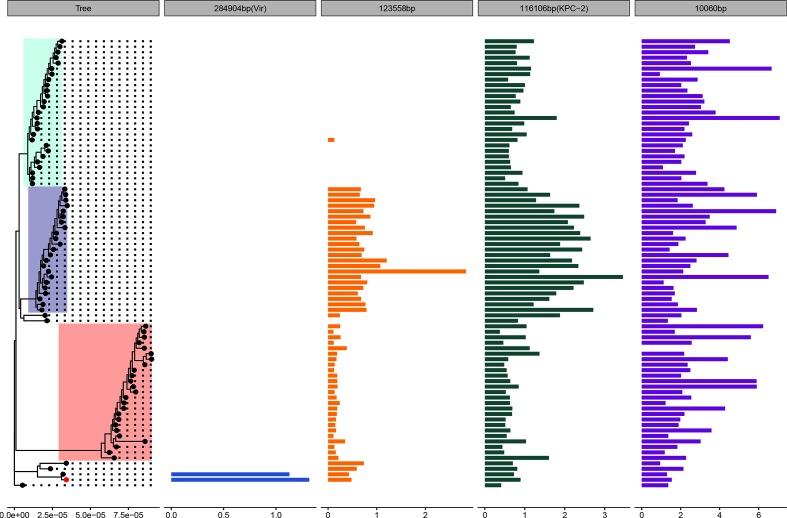
Fig. 4.
Coverage of outbreak isolates to the CX90 assembly highlights variation in plasmid carriage and copy number. Mean coverage per isolate of 82 short-read sequenced ST11 K. pneumoniae mapped to the complete genome of CX90 (red tip point), sampled from the ‘index’ patient, Patient X, and sequenced using long-read technology. The phylogeny to the left provides the chromosomally dated phylogeny of 82 outbreak isolates, with the lineage structure highlighted in colour, as in Figs 1–3. The bar plots provide the mean coverage relative to the chromosome for each plasmid. Any isolates with a mean coverage relative to the chromosome <0.1× are not shown.

