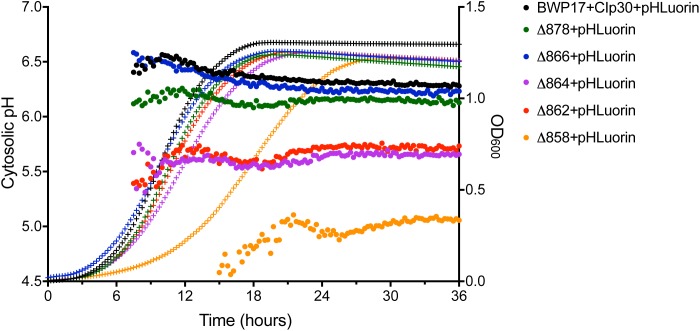
FIGURE 2.
Growth and cytosolic pH in Pma1p truncation mutants. Growth and cytosolic pH were measured concurrently in Pma1p truncation mutants by growing cells in YNB with 2% glucose in a plate reader with OD600 readings and cytosolic pH readings taken at 15 min intervals. Cytosolic pH is plotted on the left y-axis and is represented by closed circles. OD600 is plotted on the right y-axis and is represented by + symbols. Increased Pma1 truncation is correlated with decreased growth and increased cytosolic acidification. Graph represents the average of four individual experiments.

