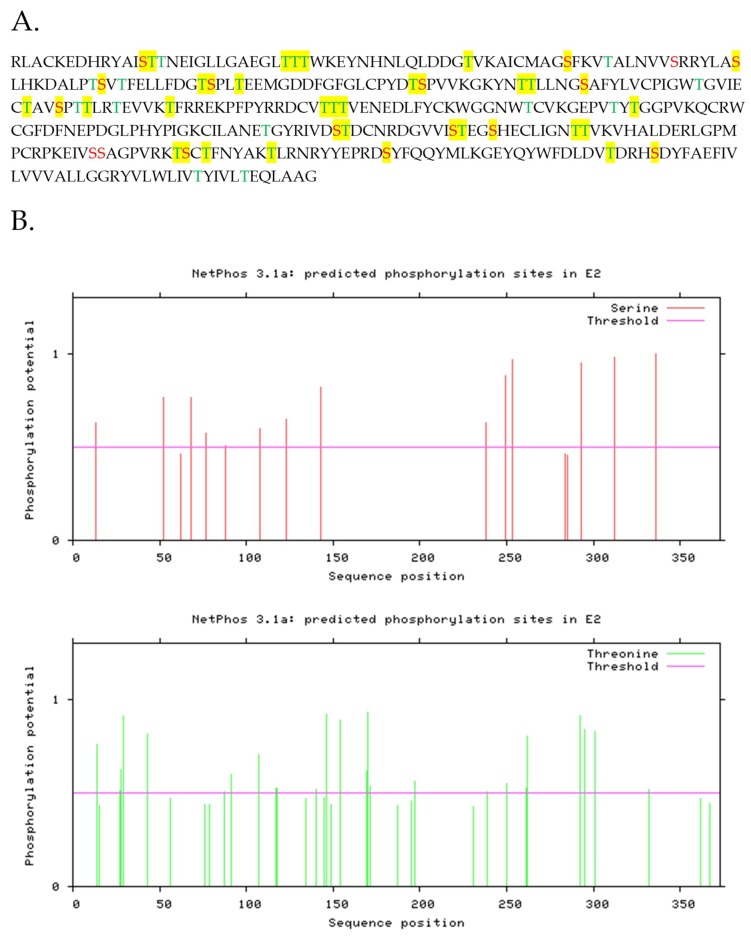
Figure 3.
Prediction of phosphorylation sites in CSFV E2 (A) Amino acid sequence of CSFV E2 with serine displayed in red and threonine displayed in green. Highlighted residues indicate residues that are predicted to be phosphorylated. (B) Prediction in NetPhos displaying the phosphorylation potential.

