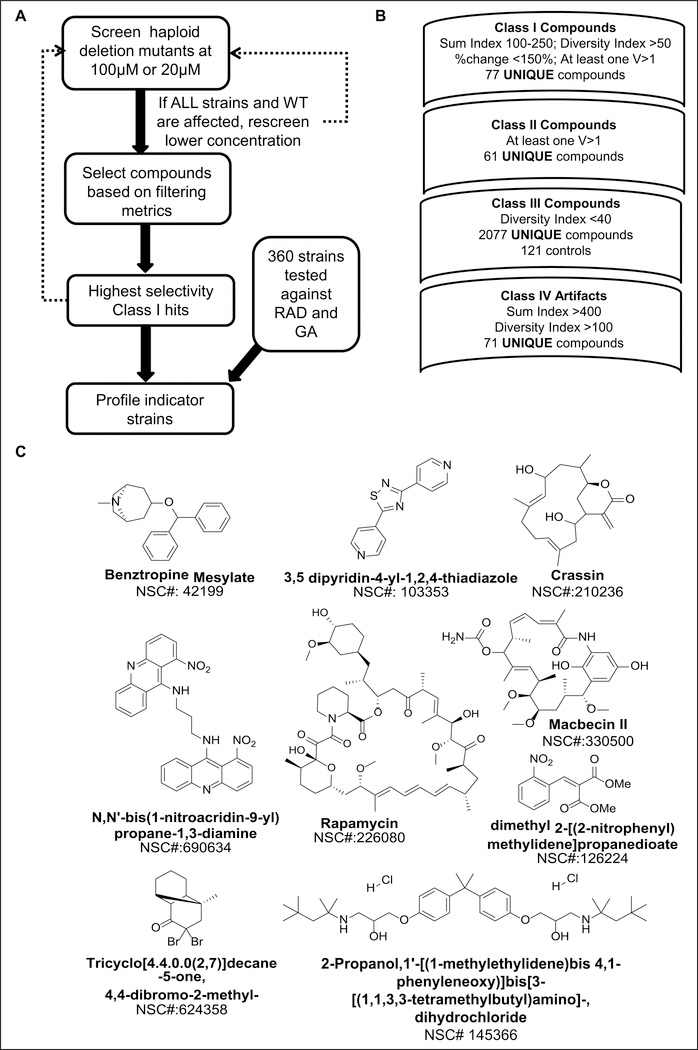
Figure 2.
Chemical library screen protocol and process of filtering. (A) The general workflow of the chemical library screen depicting the main steps in the screen. A parallel effort to define additional heat shock network indicator strains was also conducted to further characterize hits from the primary screen. (B) Detailed view of filtering metrics (SUM index and diversity index) used to identify various compound classes (classes 1–IV) from the chemical libraries. Further details of the criteria and actual results of filter steps are provided in Supplementary Figure S3. (C) The top nine class I compounds and their structures. Examples of the curve phenotype data for these compounds against the initial four strains are provided in Supplementary Figure S4.

