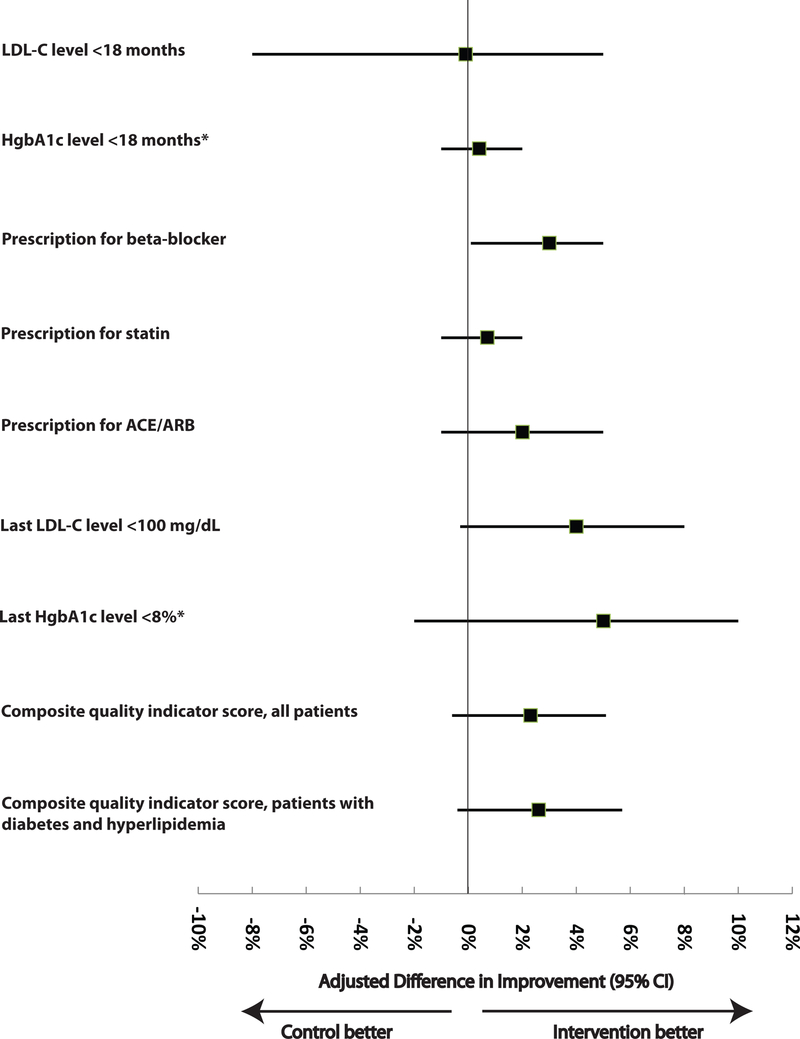
Figure 2: Adjusted Differences in Improvement in the Clinical Indicators, Intervention Minus Control.
Abbreviations: ACE = angiotensin-converting enzyme; ARB = angiotensin-receptor blocker; LDL-C = low-density lipoprotein cholesterol; HgbA1c = hemoglobin A1c.
*Among adults with diabetes.
†Difference in improvement was the change (post-intervention minus pre-intervention, except for the physiologic differences, where the signs are reversed because decrease signifies improvement) among intervention clinics minus the change among control clinics. A positive difference reflects greater improvement among intervention clinics. ‡With use of generalized mixed-effects regression models, these differences and the associated 95% CIs and P-values reflect adjustment for patient clustering within clinics, patient-level covariates (age, sex, race, and co-morbidity score) and random clinic effects (to account for correlation of patient measures within individual clinics). Co-morbidity score was calculated using a composite score based on 12 major health conditions: hypertension, hyperlipidemia, diabetes mellitus, heart failure, emphysema, depression, chronic kidney disease, stroke, cancer (excluding skin, prostate or thyroid), peripheral vascular disease, dementia, and asthma. LDL cholesterol and HgbA1c levels for eligible patients who had measurement within 18 months of the index visit. Laboratory level or prescription measured at the time of the index visit.

