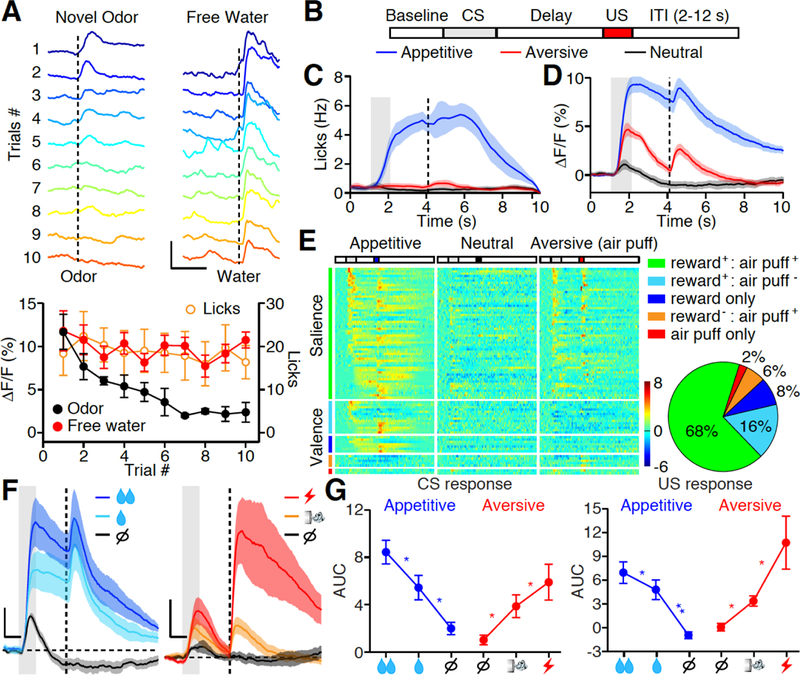
Fig. 1. PVT neurons encode salience irrespective of valence.

(A) Top: Photometric traces of calcium responses in the PVT to 10 repetitions of randomized odor (Left) and water (5μl, Right) stimuli. Dashed line indicates the time of stimulus delivery. Scale bar, 10% ΔF/F, 3 s. Bottom: Left Y axis, quantification of odor (black dot) and free water (red dot) evoked ΔF/F over 10 repetitions. Right Y axis, quantification of free water (orange circle) evoked licks over 10 repetitions. Novel odor: n = 6 mice; Free water n = 12 mice; Licks: n = 12 mice. (B) Trial structure of the Pavlovian conditioning paradigm. ITI, inter-trial interval. CS: conditioned stimulus; US: unconditioned stimulus. (C) Mean lick rate of well-trained animals (n = 7) shows anticipatory licking in appetitive (blue) but not neutral (black) and aversive (red) trials. Gray bar: 1s of CS delivery; Vertical dash line: US delivery. (D) Mean photometric responses of the PVT to CS and US in both appetitive (blue) and aversive (red) but not neutral (black) trials. Shade, SEM across mice, n = 7 mice. (E) Z score heat maps (left) and pie chart (right) for all task-responding neurons identified by in vivo single-unit recording during Pavlovian tasks of well-trained animals. Neurons are separated in five subgroups based on their tuning properties, and are rank-ordered by their response onset times during reward cue stimulation. Each row in the heat maps represents responses from the same neuron to different stimuli. n = 85 neurons from 12 mice. (F, G) Mean photometric responses (F, n = 7 mice) and quantification (G) showing that CS and US response in the PVT are graded to different intensity of reward (left, 5 vs 15 μl water) and punishment (right, air puff vs. tail shock). AUC, area under curve (see methods). Scale bar, 2% (F, left), 4% (F, right) ΔF/F, 1s. Big, small reward and nothing: n = 7,7,7; Big, small punishment and nothing: n = 6,6,5. *P < 0.05, **P < 0.01 (One-way ANOVA, Post-hoc Tukey’s test). Shade, SEM across mice in C, D, F. Data are means ± SEM.
