
Fig. 2. Dynamics of salience response in PVT neurons during associative learning.
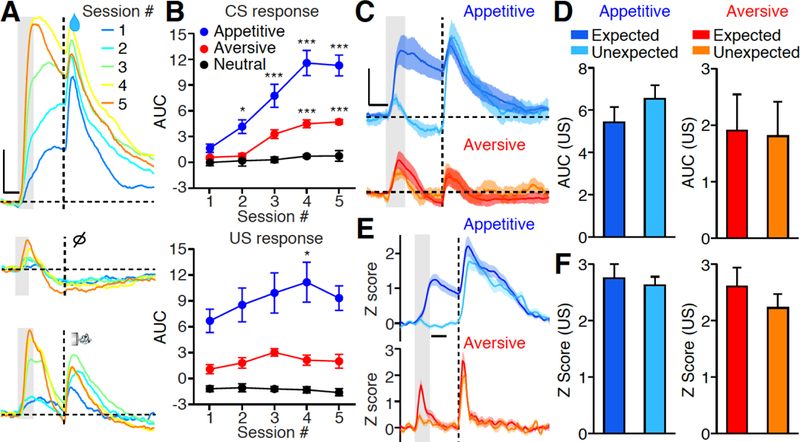
(A) Representative photometric responses in the PVT across multiple sessions of Pavlovian conditioning (session 1 to 5). Gray bar: 1s of CS delivery; Vertical dash line: US delivery; Horizontal dash line: baseline ΔF/F. Upper panel: appetitive; Middle panel: nothing; Lower panel: aversive. Scale bar: 5% ΔF/F. Each photometric trace is averaged from all 50 trials within single conditioning session. (B) Quantification of CS response (top) and US response (bottom) across 5 training sessions (n = 6). Note the significant increase of CS responses following training, whereas the US responses remain consistent. *P < 0.05, **P < 0.01, ***P < 0.001 (Two-way ANOVA, Post-hoc Bonferroni test). (C) Mean photometric responses of the PVT to expected and unexpected delivery of reward (top, n = 10; Dark blue: expected; Light blue: unexpected) and punishment (bottom, n = 10; Red: expected; Orange: unexpected). Scale bar: 4% ΔF/F. (D) Quantification of C. Wilcoxon signed-rank test: P = 0.32 (Reward); P = 0.49 (Punishment). (E) Mean Z score of single unit responses of the PVT neurons to expected and unexpected delivery of reward (top, n = 31 neurons) and punishment (bottom, n = 22 neurons). (F) Quantification of E. Wilcoxon signed-rank test: P = 0.28 (Reward); P = 0.11 (Punishment). Gray bar: 1s of CS delivery; Vertical dash line: US delivery, Scale bar: 1s in A, C, E. Shade, SEM across mice in C, E. Data are means ± SEM.